James McArdle
GIS Analyst
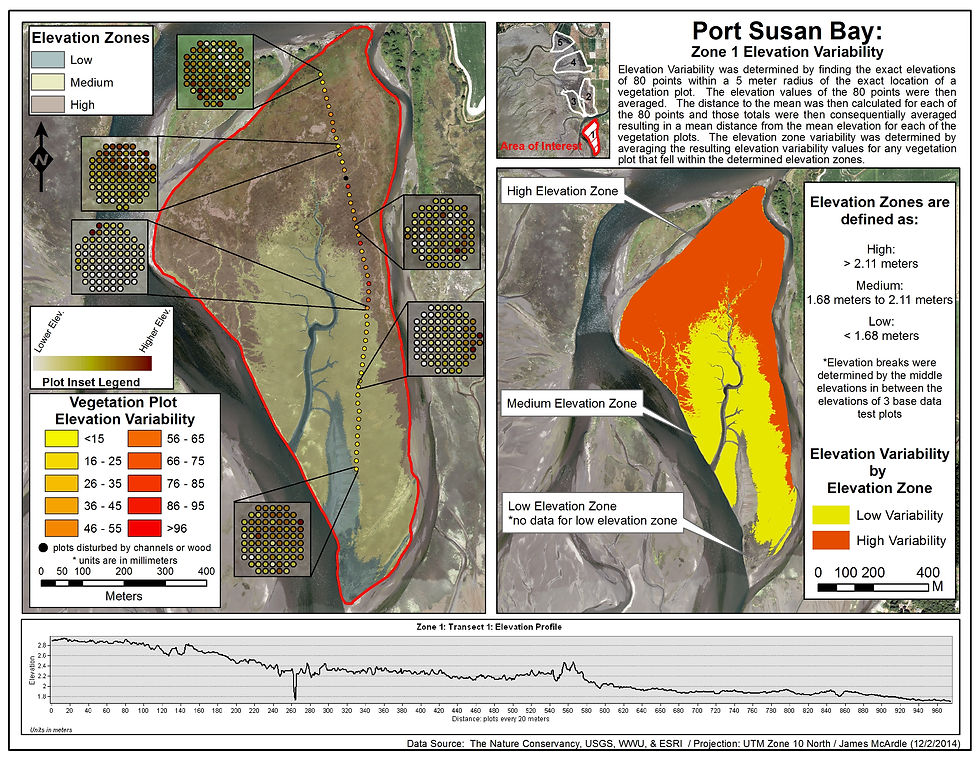
Each of the following maps had the elevation variability calculated for all vegetation plots in each zone and then attributed to 3 elevation zones in each distinct study zone. The 3 elevation zones were determined by using breaks in the median elevations of 3 baseline data test points. The Vegetation Plots were placed in a transect stretching across the longest part of a zone begining in high elevation and ending in low elevation.
These sets of maps details the elevation variability of the Port Susan Bay Estuary and each of the 5 study zones within the Estuary.
Port Susan Bay Elevation Variability Analysis
Analysis based off of Vegetation Plot Data


Analysis based off of Zone Area Plot Data
Each of the following maps had the elevation variability calculated for all Zone Area Plots in each zone and then attributed to 3 elevation zones in each distinct study zone. The 3 elevation zones were determined by using breaks in the median elevations of 3 baseline data test points. The Zone Area Plots are 5 meters in radius and the center of each plot has been placed in a grid with the study zones with the center of each plot 20 meters apart.